
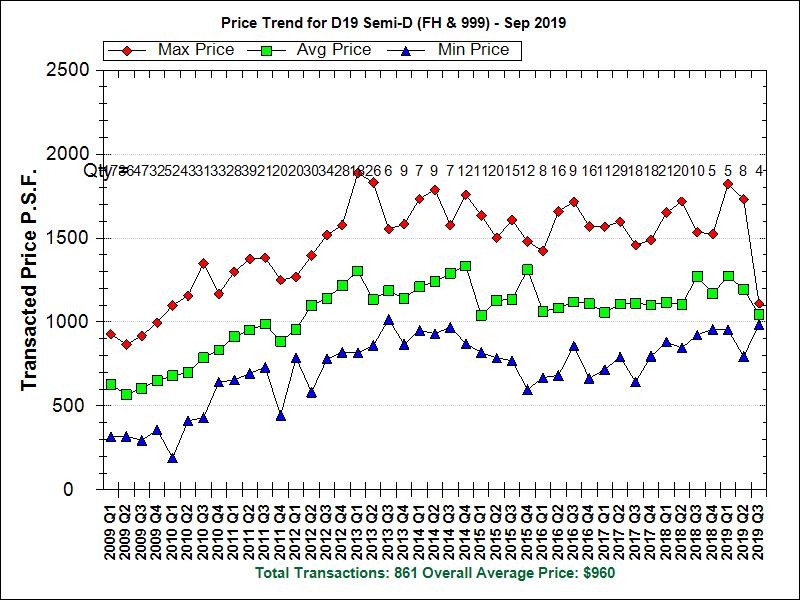
** Latest PSF Prices for District 19 Semi-D**
There was a recovery in transaction volume in Q2 of 2017 with 29 units of Semi-Ds transacted in the quarter, versus 11 units in Q1. This strong volume momentum lasted only 5 quarters (see breakdown below) until the Q2 of 2018, where 20 units were transacted.
The government implemented additional property cooling measure on 29 Jun 2018. The impact was immediate and Q3 2018 saw a reduction in number of transactions to 10 units. The quarterly transacted figures have stayed below 10 units for every quarter since then.
Price-wise, there is no clear direction of psf price movement. In fact, psf prices in 2019 have remain pretty much the same as during the period between 2013 and 2014.
Volume transactions of Semi-Ds in D19:
2010: 159
2011: 108
2012: 111
2013: 59
2014: 35
2015: 58
2016: 49
2017: 76 (Q1:11, Q2:29, Q3:18, Q4: 18)
2018: 56 (Q1:21, Q2:20, Q3:10, Q4:5)
2019: 17 (Q1: 5, Q2: 8, Q3:4)
P.S:
The price curve includes only PSF prices for freehold/999-year landed semi-detached houses only. The original source data includes PSF price of cluster (or strata landed) houses, but we have remove these eroneous data point because it may skew the overall price trend depending the number of cluster houses being transacted in that month or quarter.