
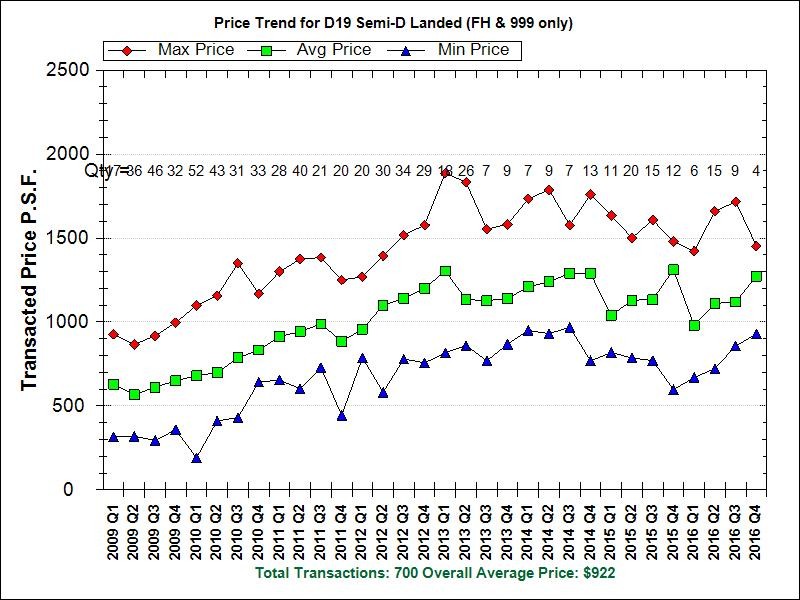
** D19 Freehold Semi-D Tranacted Prices from Jan 2009 to Nov 2016**
Prices peaked in Q1 of 2013 and then began a very gradual decline.
The volume decline is more drastic. From a peak of 159 transactions in 2010, the number of transaction has reduced by more than 50%.
2010: 159
2011: 109
2012: 113
2013: 60
2014: 36
2015: 58 (46 during its first 3 quarters)
2016: 30 (first 3 quarters)
In fact, for those who think 2016 is more active than 2015, the data suggests otherwise. The three quarters in 2016 generated 30 transactions for FH/999 Semi-Ds in District 19, versus 46 during the equivalent period in 2015. This is a decline of 35% in number of Semi-Ds transacted.
However, there is some light at the end of the tunnel. At the bottom end of Semi-D transacted prices, quarterly PSF prices have risen for 4 quarters in a row. Hopefully this indicates that the decline has reached a support and will not go further down.