
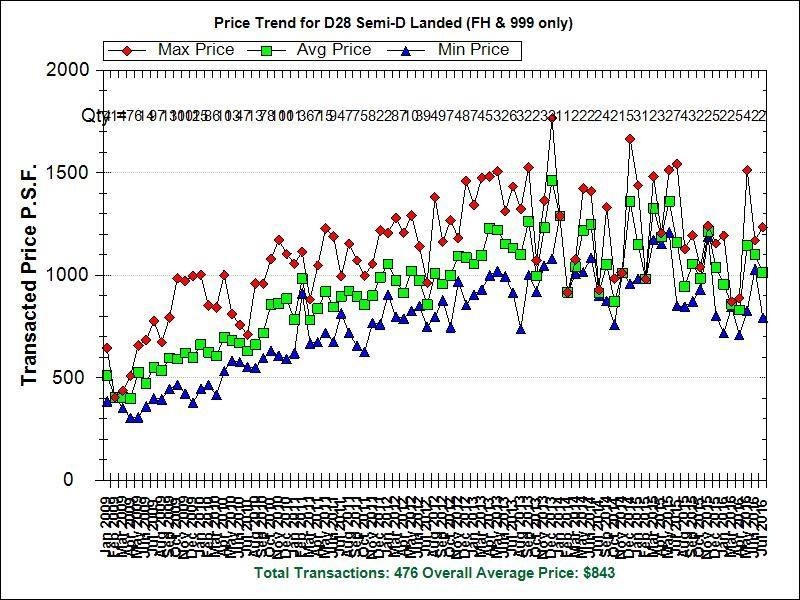
From the charts, we can see clearly that D28 Semi-D prices peaked at around Nov 2013, about 4 months after imposition of TDSR by the government on 29 Jun 2013.
During the period from Nov 2013 to July 2016, there is a noticeable downtrend for transacted PSF prices for both brand-new landed properties (usually represented by the RED dots) and the original 1-sty or 2-sty landed homes.
From the quarterly data, we observed that PSF prices for landed properties have fallen back roughly to the 2012 Q1’s level.
We also notice there is a pronounced drop in transactions volume. This can be seen when you compare the period from 2009 to 2012 (about 24 sales per quarter) to the 2013 to 2016 period (about 11 sales per quarter).
There is still no sign of turnaround. Are there light at end of tunnel?